Planning Your Next Vacation in Spain
Analysis and Modelling of the AirBnB Dataset from the Basque Country
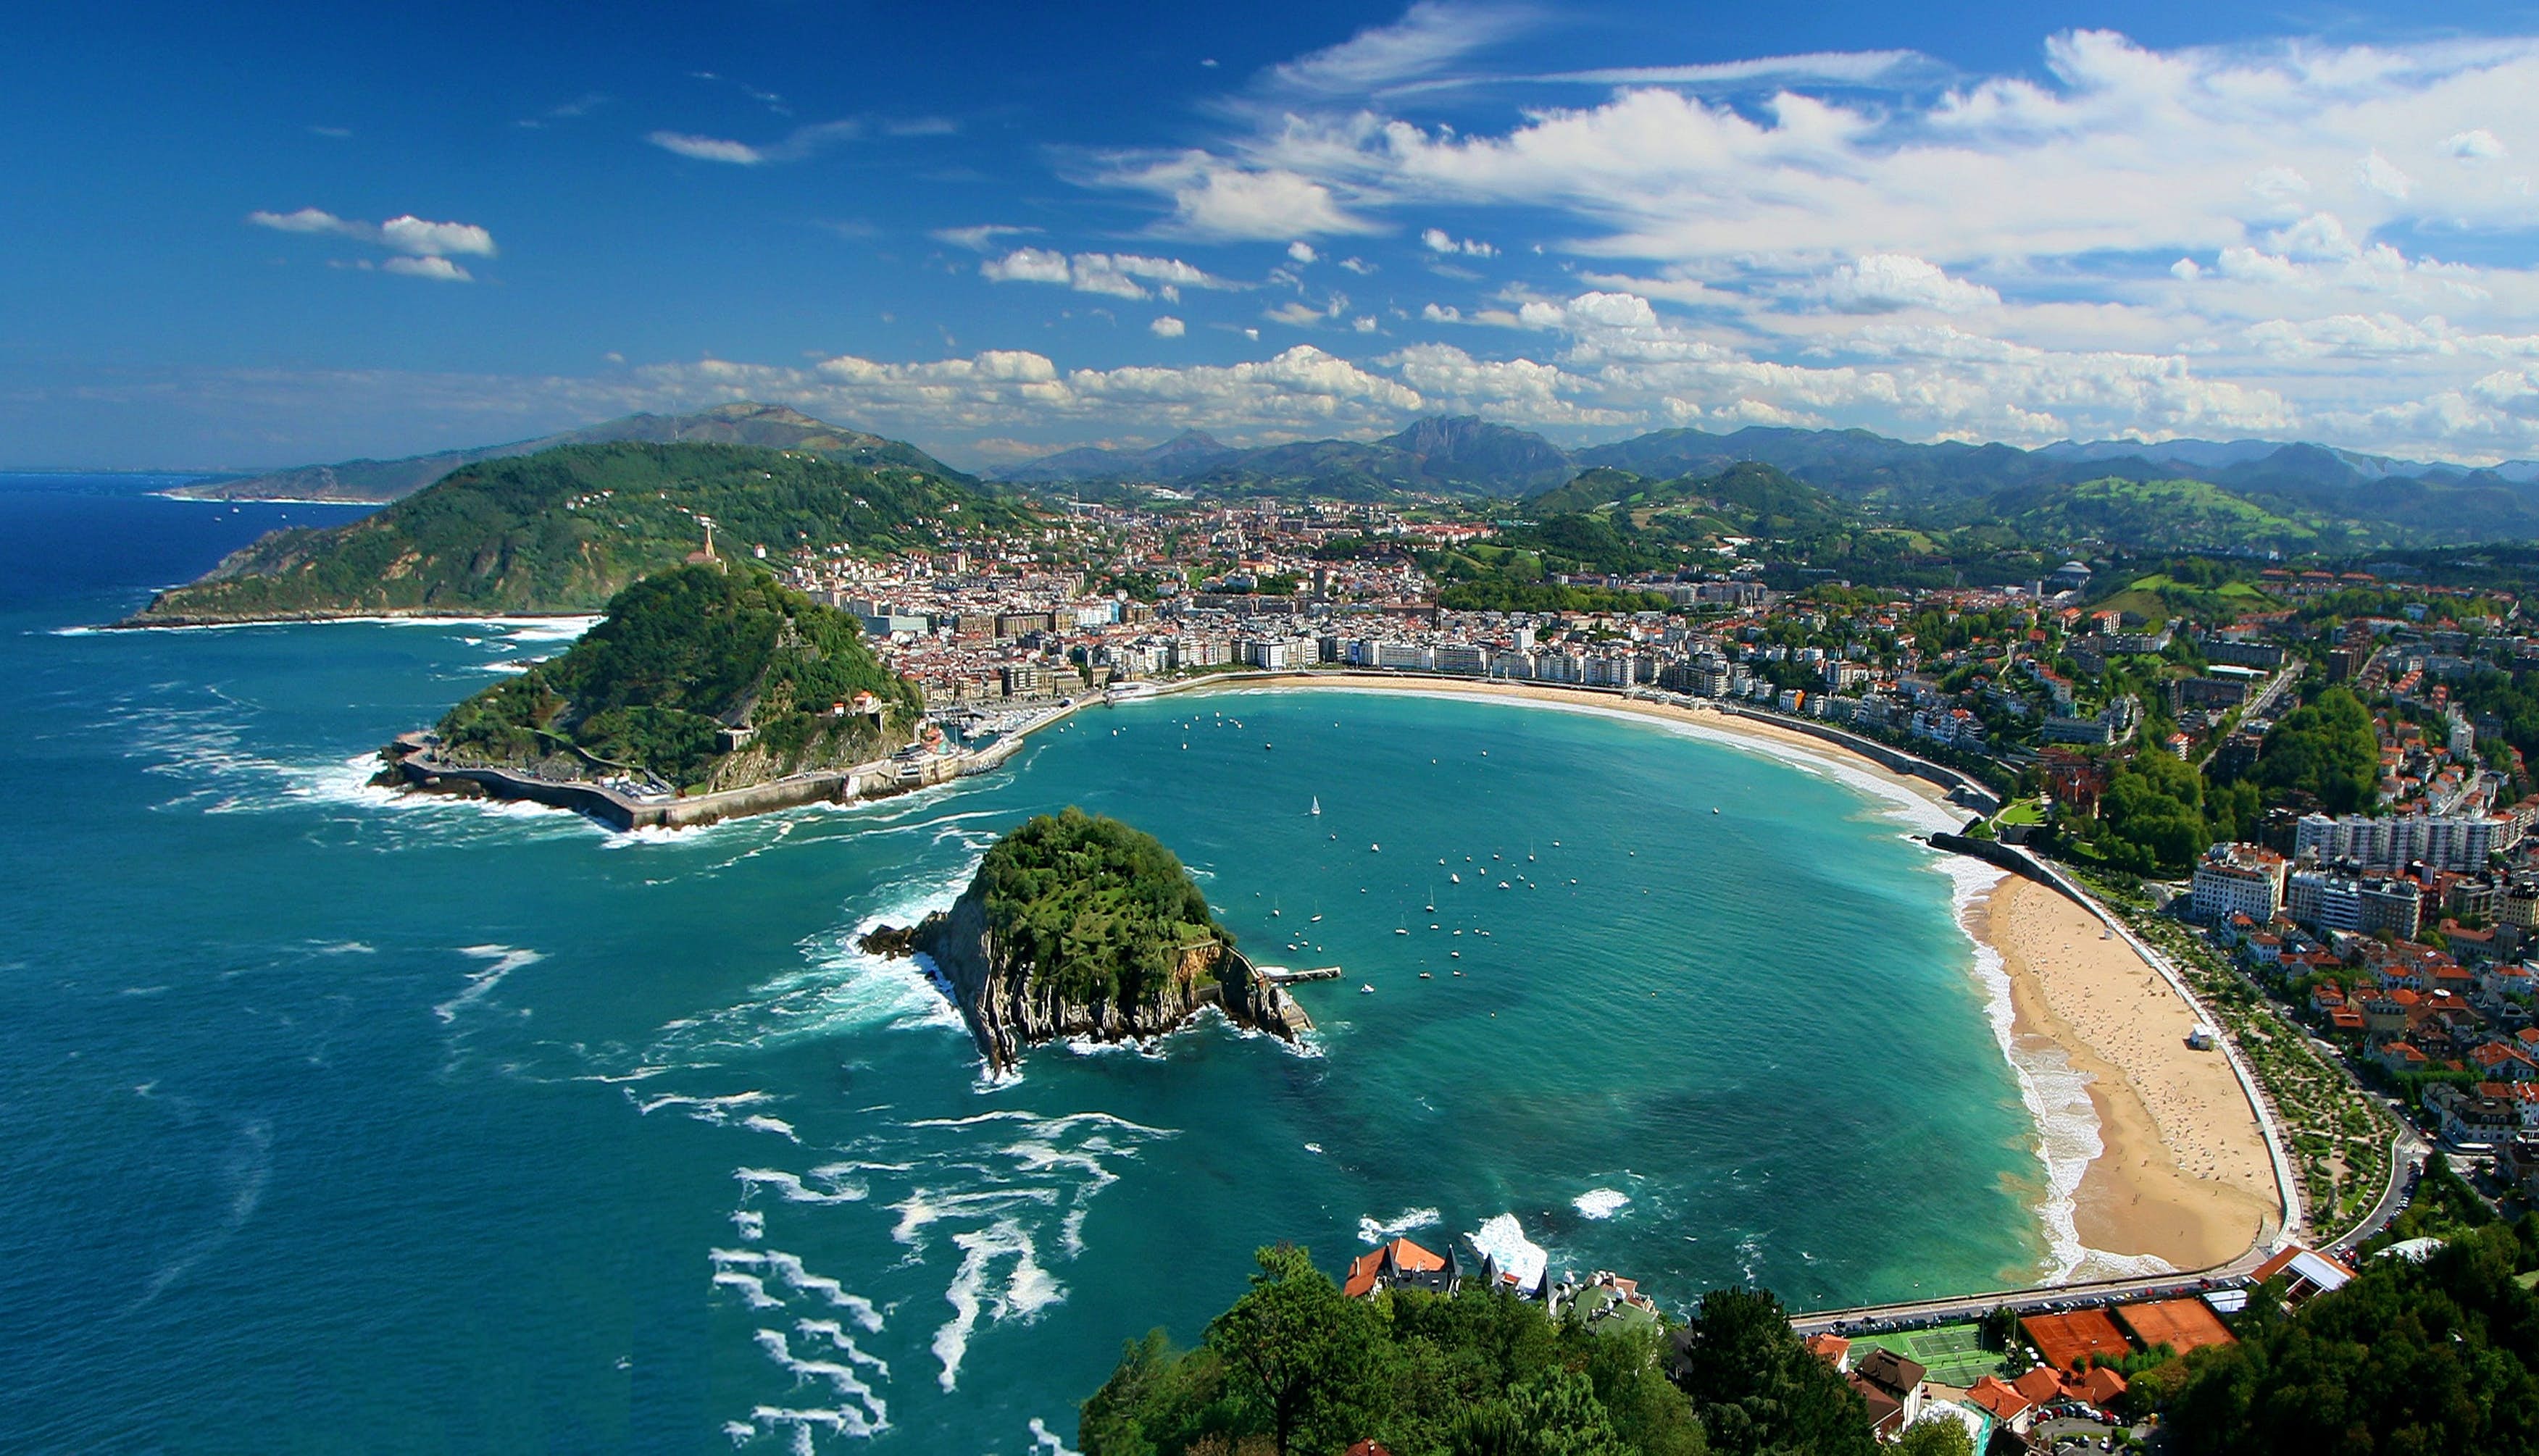 Donostia-San Sebastian. Photo by @ultrashricco from Unsplash.
In 2020 I decided to move back to my birthplace in the Basque Country (Spain) after almost 15 years in Munich (Germany). The Basque region in Spain is a popular touristic destination, as it has a beautiful seaside with a plethora of surfing spots and alluring hills that call for hiking and climbing adventures. Culture and gastronomy are also important features, both embedded in a friendly and developed society with modern infrastructure.
When the pandemic seemed to start fading away in spring 2022, friends and acquaintances from Europe began asking me about the best areas and trips in the region, hotels and hostels to stay in case there was no room in my place, etc. The truth is, after so many years abroad I was not the best person to guide them with updated information; however, the AirBnB dataset from Euskadi (i.e., Basque Country in Basque language) has clarified some of my questions. The dataset contains, among others, a list of 5228 accommodations, each one of them with 74 variables.
Following the standard CRISP-DM process for data analysis, I have cleaned, processed and modelled the dataset to answer three major business questions:
- Prices. Is it possible to build a model that predicts the price from the variables? If so, which are the most important variables that determine the price? Can we detect accommodations that, having a good review score, are a bargain?
- Differences between accommodations with and without beach access. Surfing or simply enjoying the seaside are probably some important attractions visitors seek on their vacations. However, not all accommodations are a walk distance from a beach. How does that influence the features of the housings?
- Differences between the two most important cities: Donostia-San Sebastian and Bilbao. These province capitals are the biggest and most visited cities in the Basque Country; in fact, their listings account for 50% of all offered accommodations. However, both cities are said to have a different character: Bilbao is a bigger, modern city, without beach access but probably with richer cultural offerings and nightlife; meanwhile, Donostia-San Sebastian is more aesthetic, it has three beaches and it’s perfect for day-strolling. How are those popular differences reflected on the features of the accommodations?
The Dataset
AirBnB provides with several CSV files for each world region: (1) a listing of properties that offer accommodation, (2) reviews related to the listings, (3) a calendar and (4) geographical data. A detailed description of the features in each file can be found in the official dataset dictionary.
My analysis has concentrated on the listings file, which consists in a table of 5228 rows/entries (i.e., the accommodation places) and 74 columns/features (their attributes). Among the features, we find continuous variables, such as:
- the price of the complete accommodation,
- accommodates: maximum number of persons that can be accommodated,
- review scores for different dimensions,
- reviews per month,
- longitude and latitude,
- etc.
… categorical variables:
- neighbourhood name,
- property type (apartment, room, hotel, etc.)
- licenses owned by the host,
- amenities offered in the accommodation,
- etc.
… date-related data:
- first and last review dates,
- date when the host joined the platform,
… and image and text data:
- URL of the listing,
- URL of the pictures,
- description of the listing,
- etc.
Of course, not all features are meaningful to answer the posed questions. The explanations given on my Gihub repository describe in detail how I dealt with noisy and missing values, and how some features were dropped or some other engineered. After that processing, we get a new table with 3931 entries and 353 features.
So… Would like to have a look at what I have learned from the data? Let’s dive in!
Question 1: Prices
In order check whether we can predict the price, I have trained several models with 90% of the processed dataset (i.e., the training split) using Scikit-Learn: (1) linear regression as baseline, (2) Ridge regression (L2 regularized regression), (3) Lasso regression (L1 regularized regression) and (2) random forests. Cross-validation was performed with all of them and their hyperparameters were tuned; additionally, the effect of polynomial features on the model performances was also studied, as thoroughly summarized on the Gihub repository.
The modelling experiments show that the random forests model seems to score the best R2 value for the test split: 69% of the variance can be explained with the random decision trees. Moreover, adding polynomial terms does not improve predictions for the present dataset. The following diagram shows the performance of the Ridge regression model and the random forests model with the test split using only the 353 linear features.
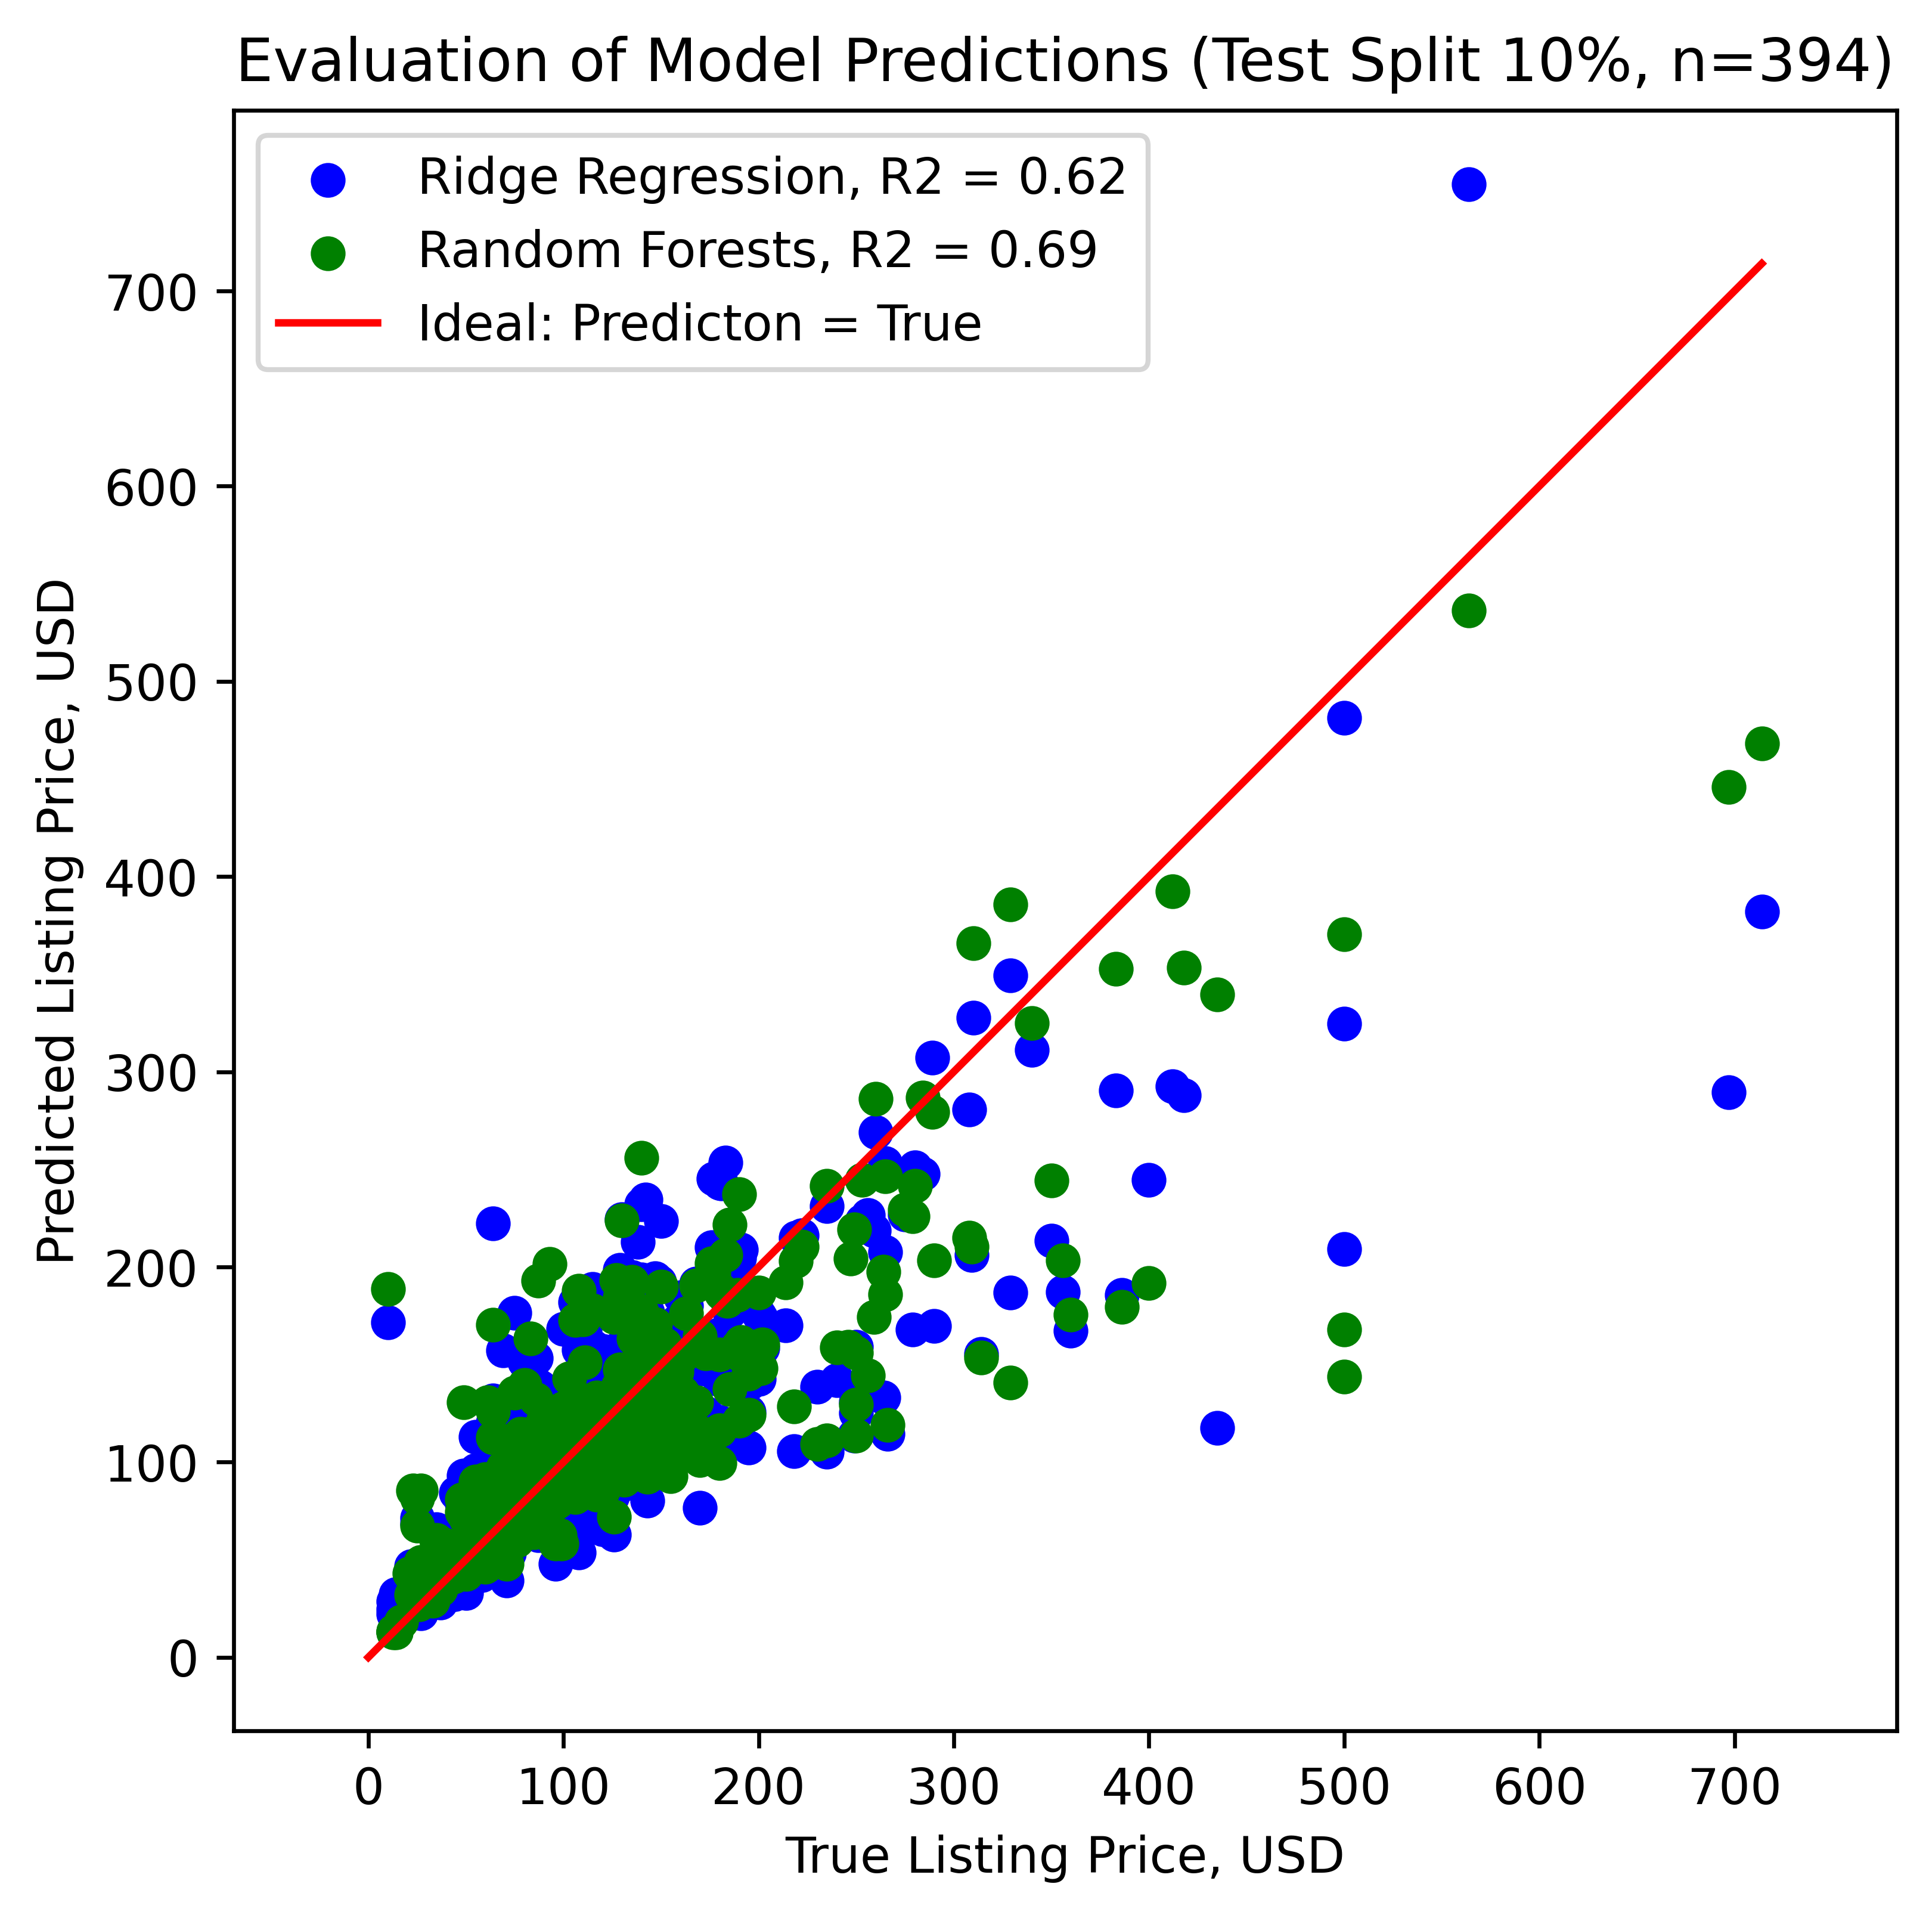
The models tend to under-predict accommodation prices; that bias clearly increases as the prices start to be larger than 50 USD. Such a moderate R2 is not the best one to apply the model to perform predictions. However, we can deduce the most important features that determine the listing prices if we compute the Gini importances, as done in the following diagram. The top-5 variables that determine the price of a listing are:
- whether an accommodation is an entire home or apartment,
- the number of bathrooms in it,
- the number of accommodates,
- whether the bathroom(s) is/are shared,
- and whether the housing is located in Donostia-San Sebastian.
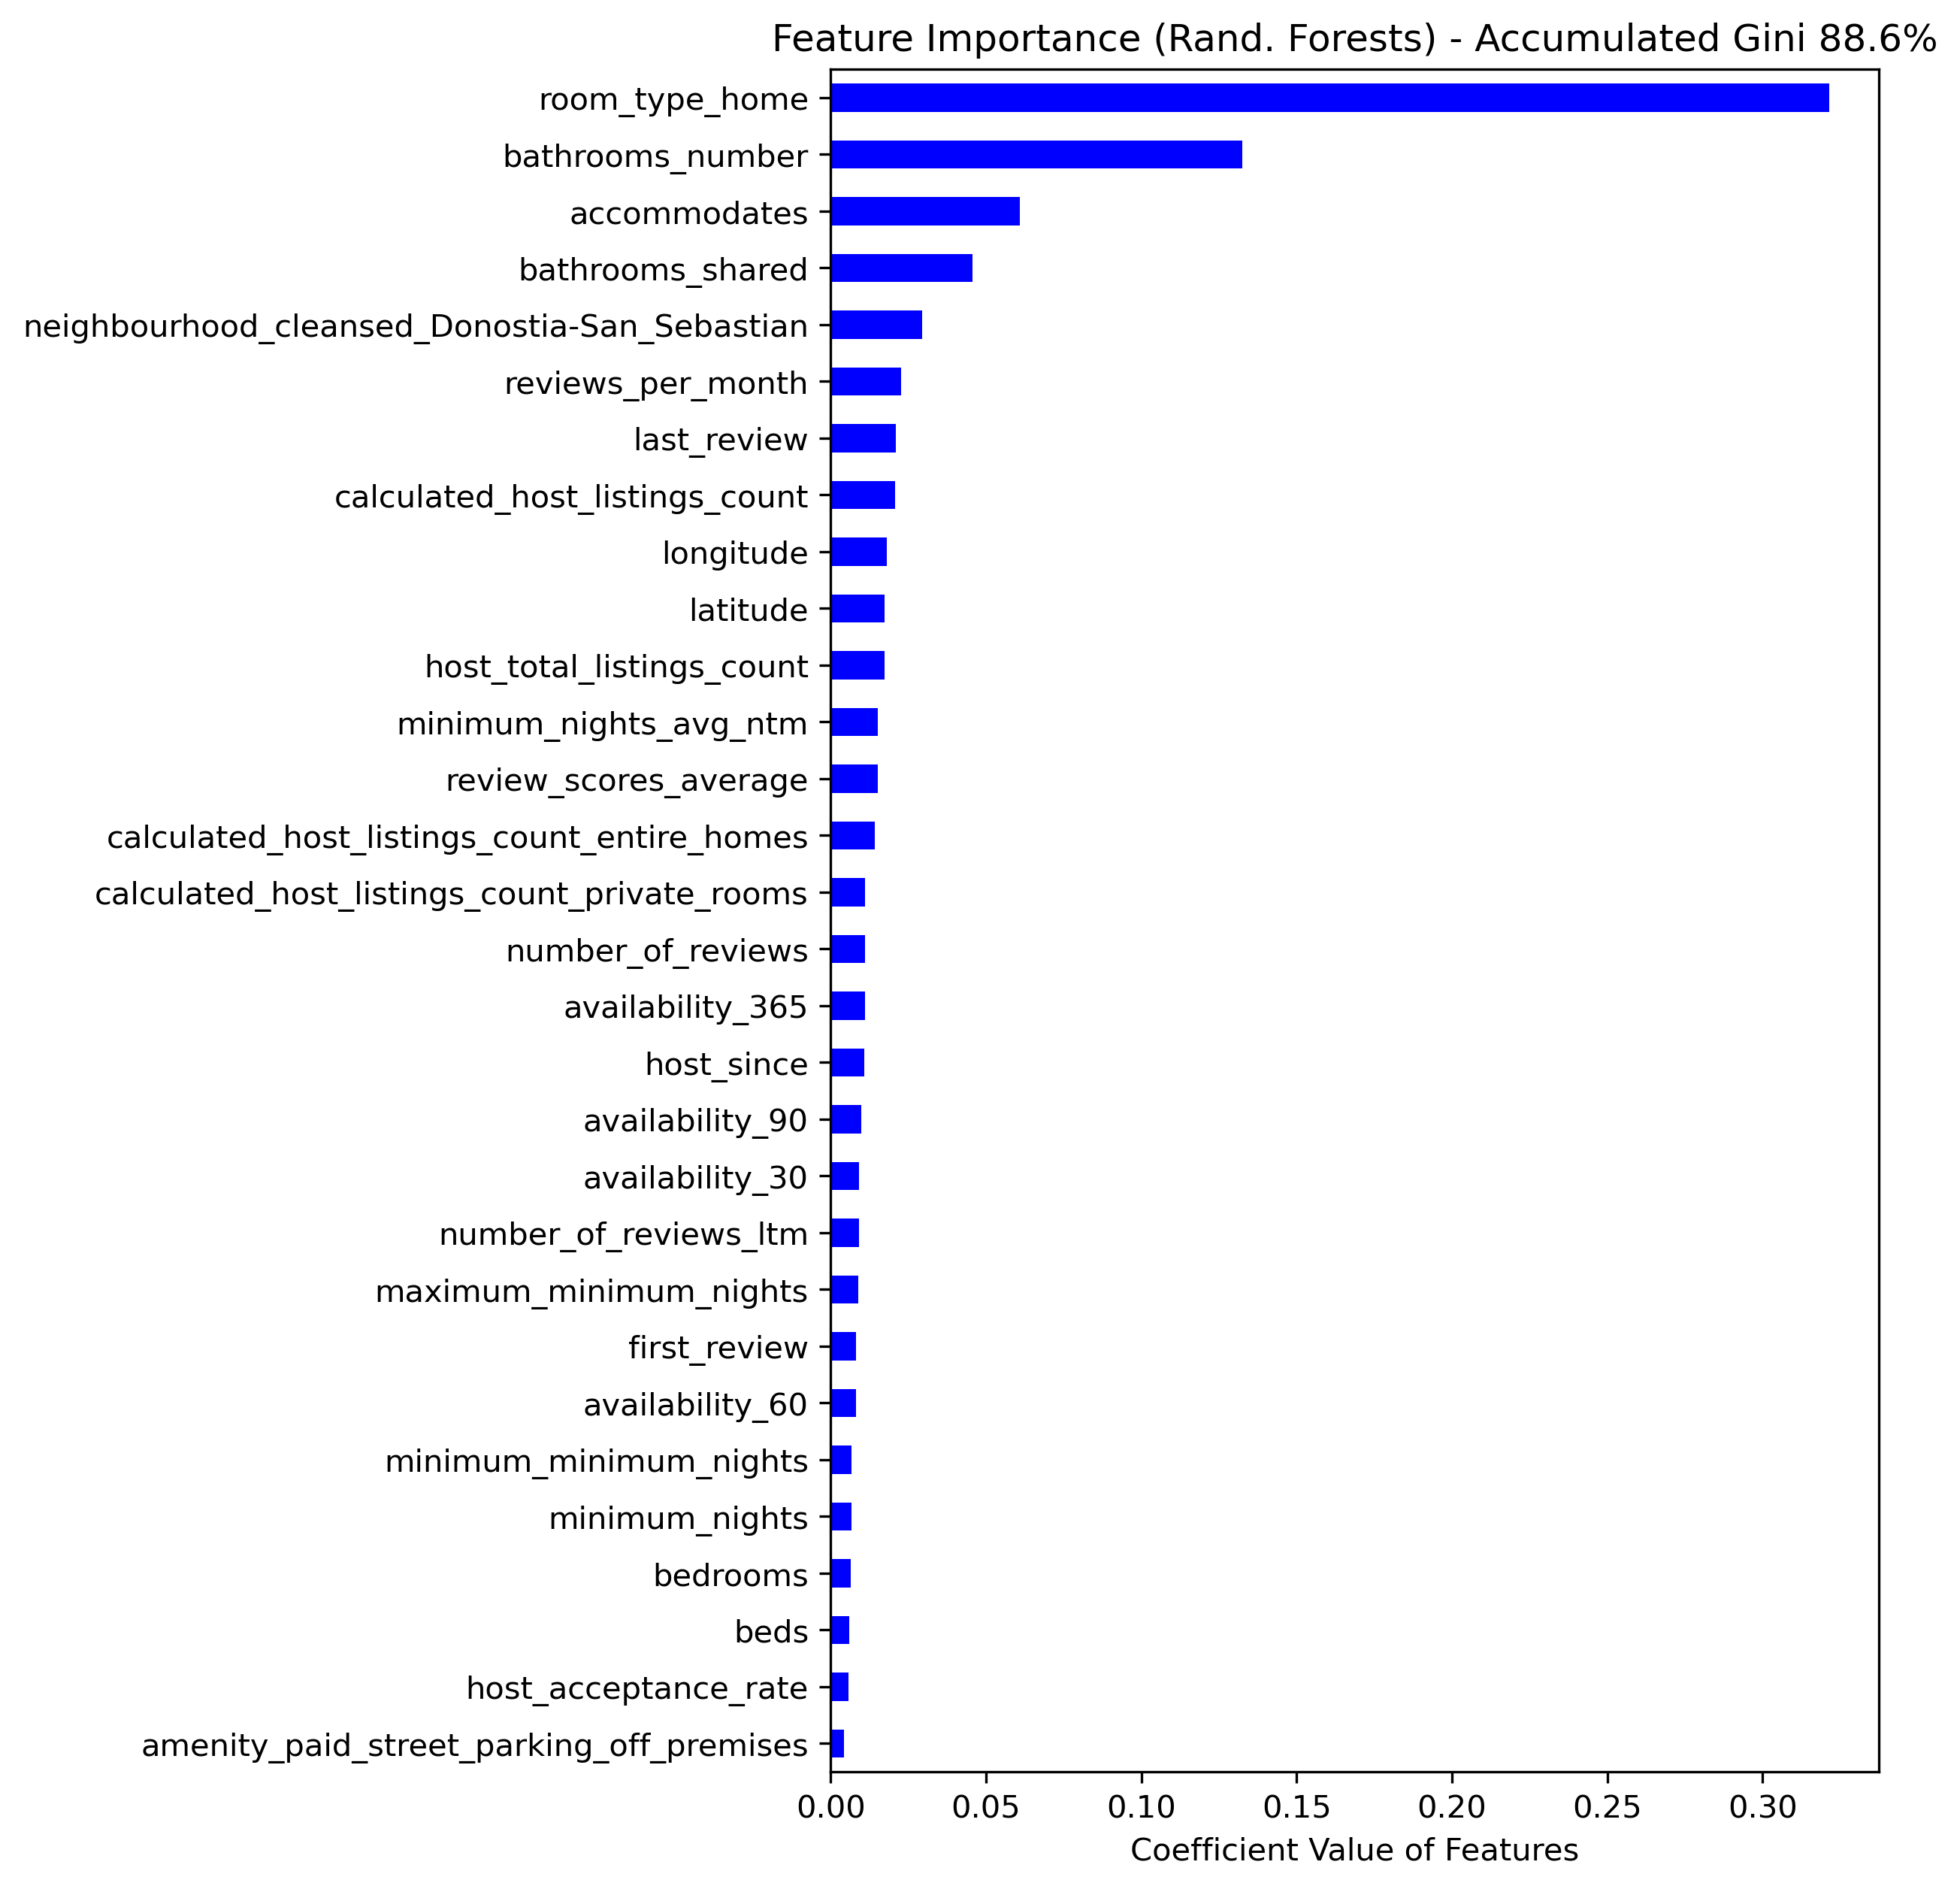
Note that only the top-30 features are shown; these account for almost 89% of the accumulated Gini importance (all 353 variables would account for 100%).
But how does increasing the value of each feature affect the price: does it contribute to an increase in price or a decrease? That can be observed in the following diagram, similar to the previous one. In contrast to the former, here the 30 regression coefficients with the largest magnitude are plotted - red bars are associated with features that decrease the price when they are increased, i.e., negative coefficients.
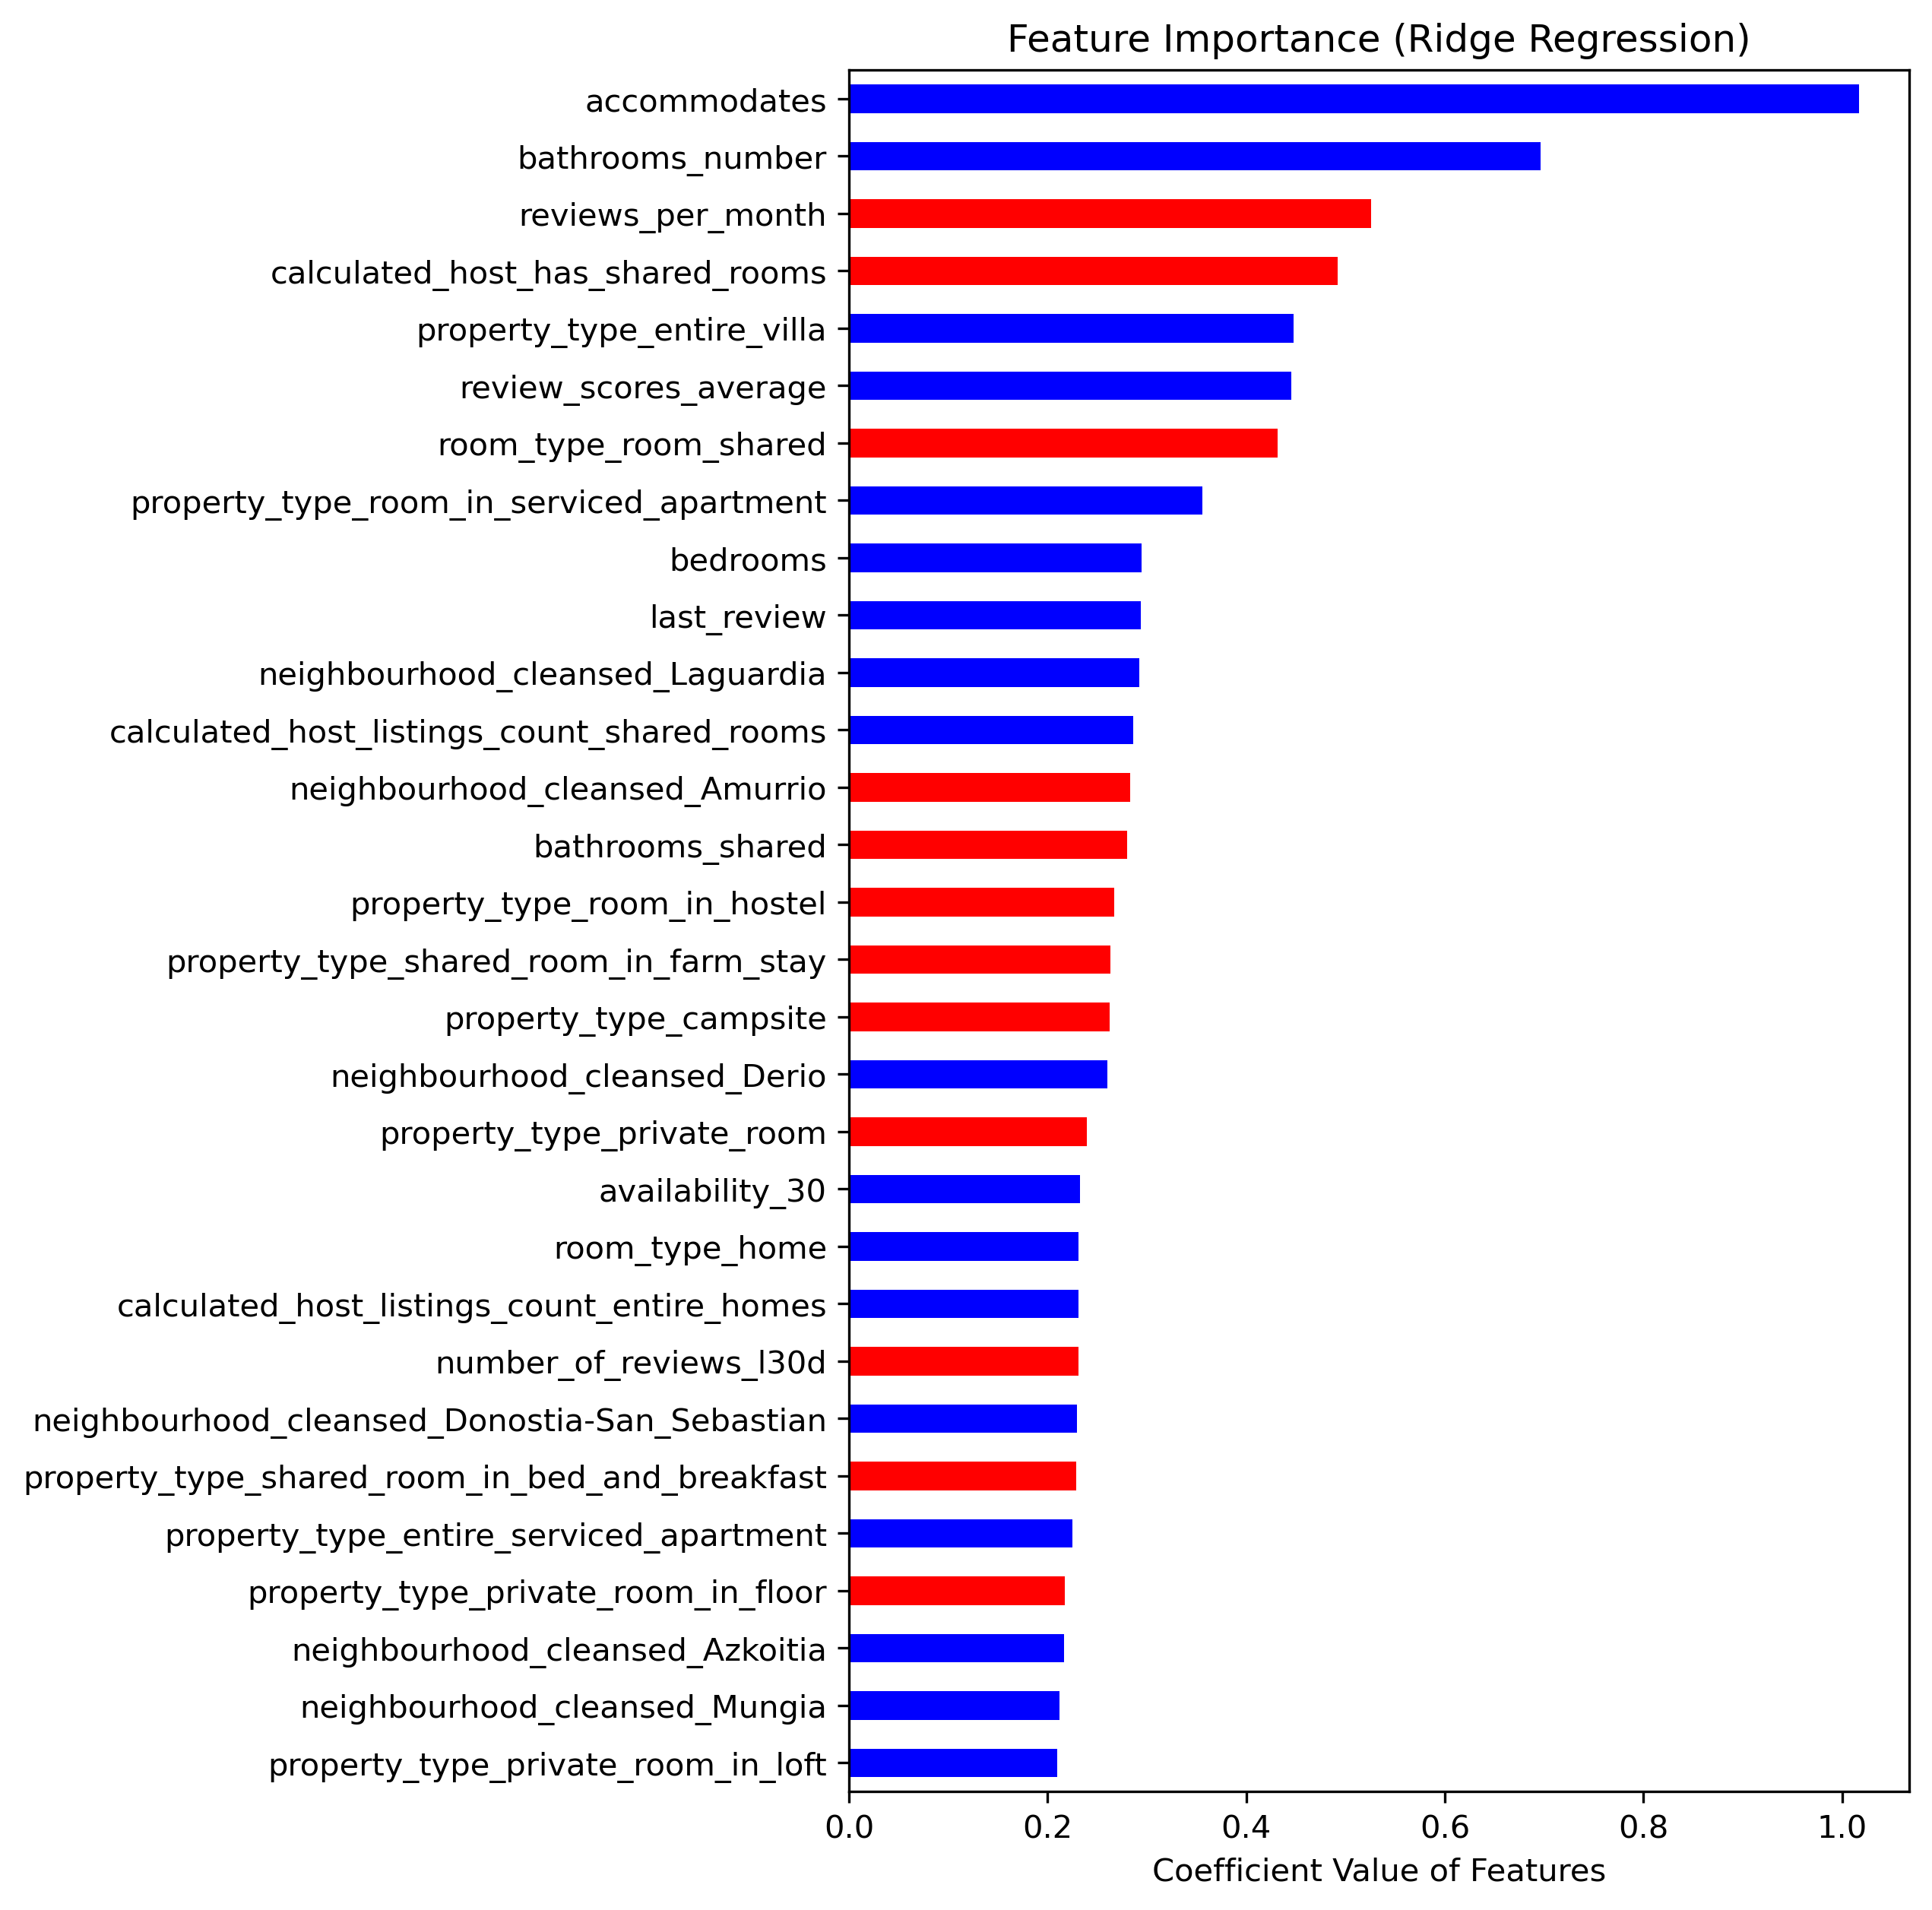
Being different models, different features appear in the ranking; in any case, both lists are consistent and provide valuable insights. For instance, we deduce that the price decreases the most when
- the number of reviews per month increases (note that review positivity is not measured),
- the host is estimated to have shared rooms,
- the accommodation is a shared room,
- and when the bathroom(s) is/are shared.
Finally, a very practical insight to close the pricing question: we can easily select the the accommodations which have a very good average review (above the 90% percentile) and yield a model price larger than the real one, as shown in the following figure. These are the likely bargains!
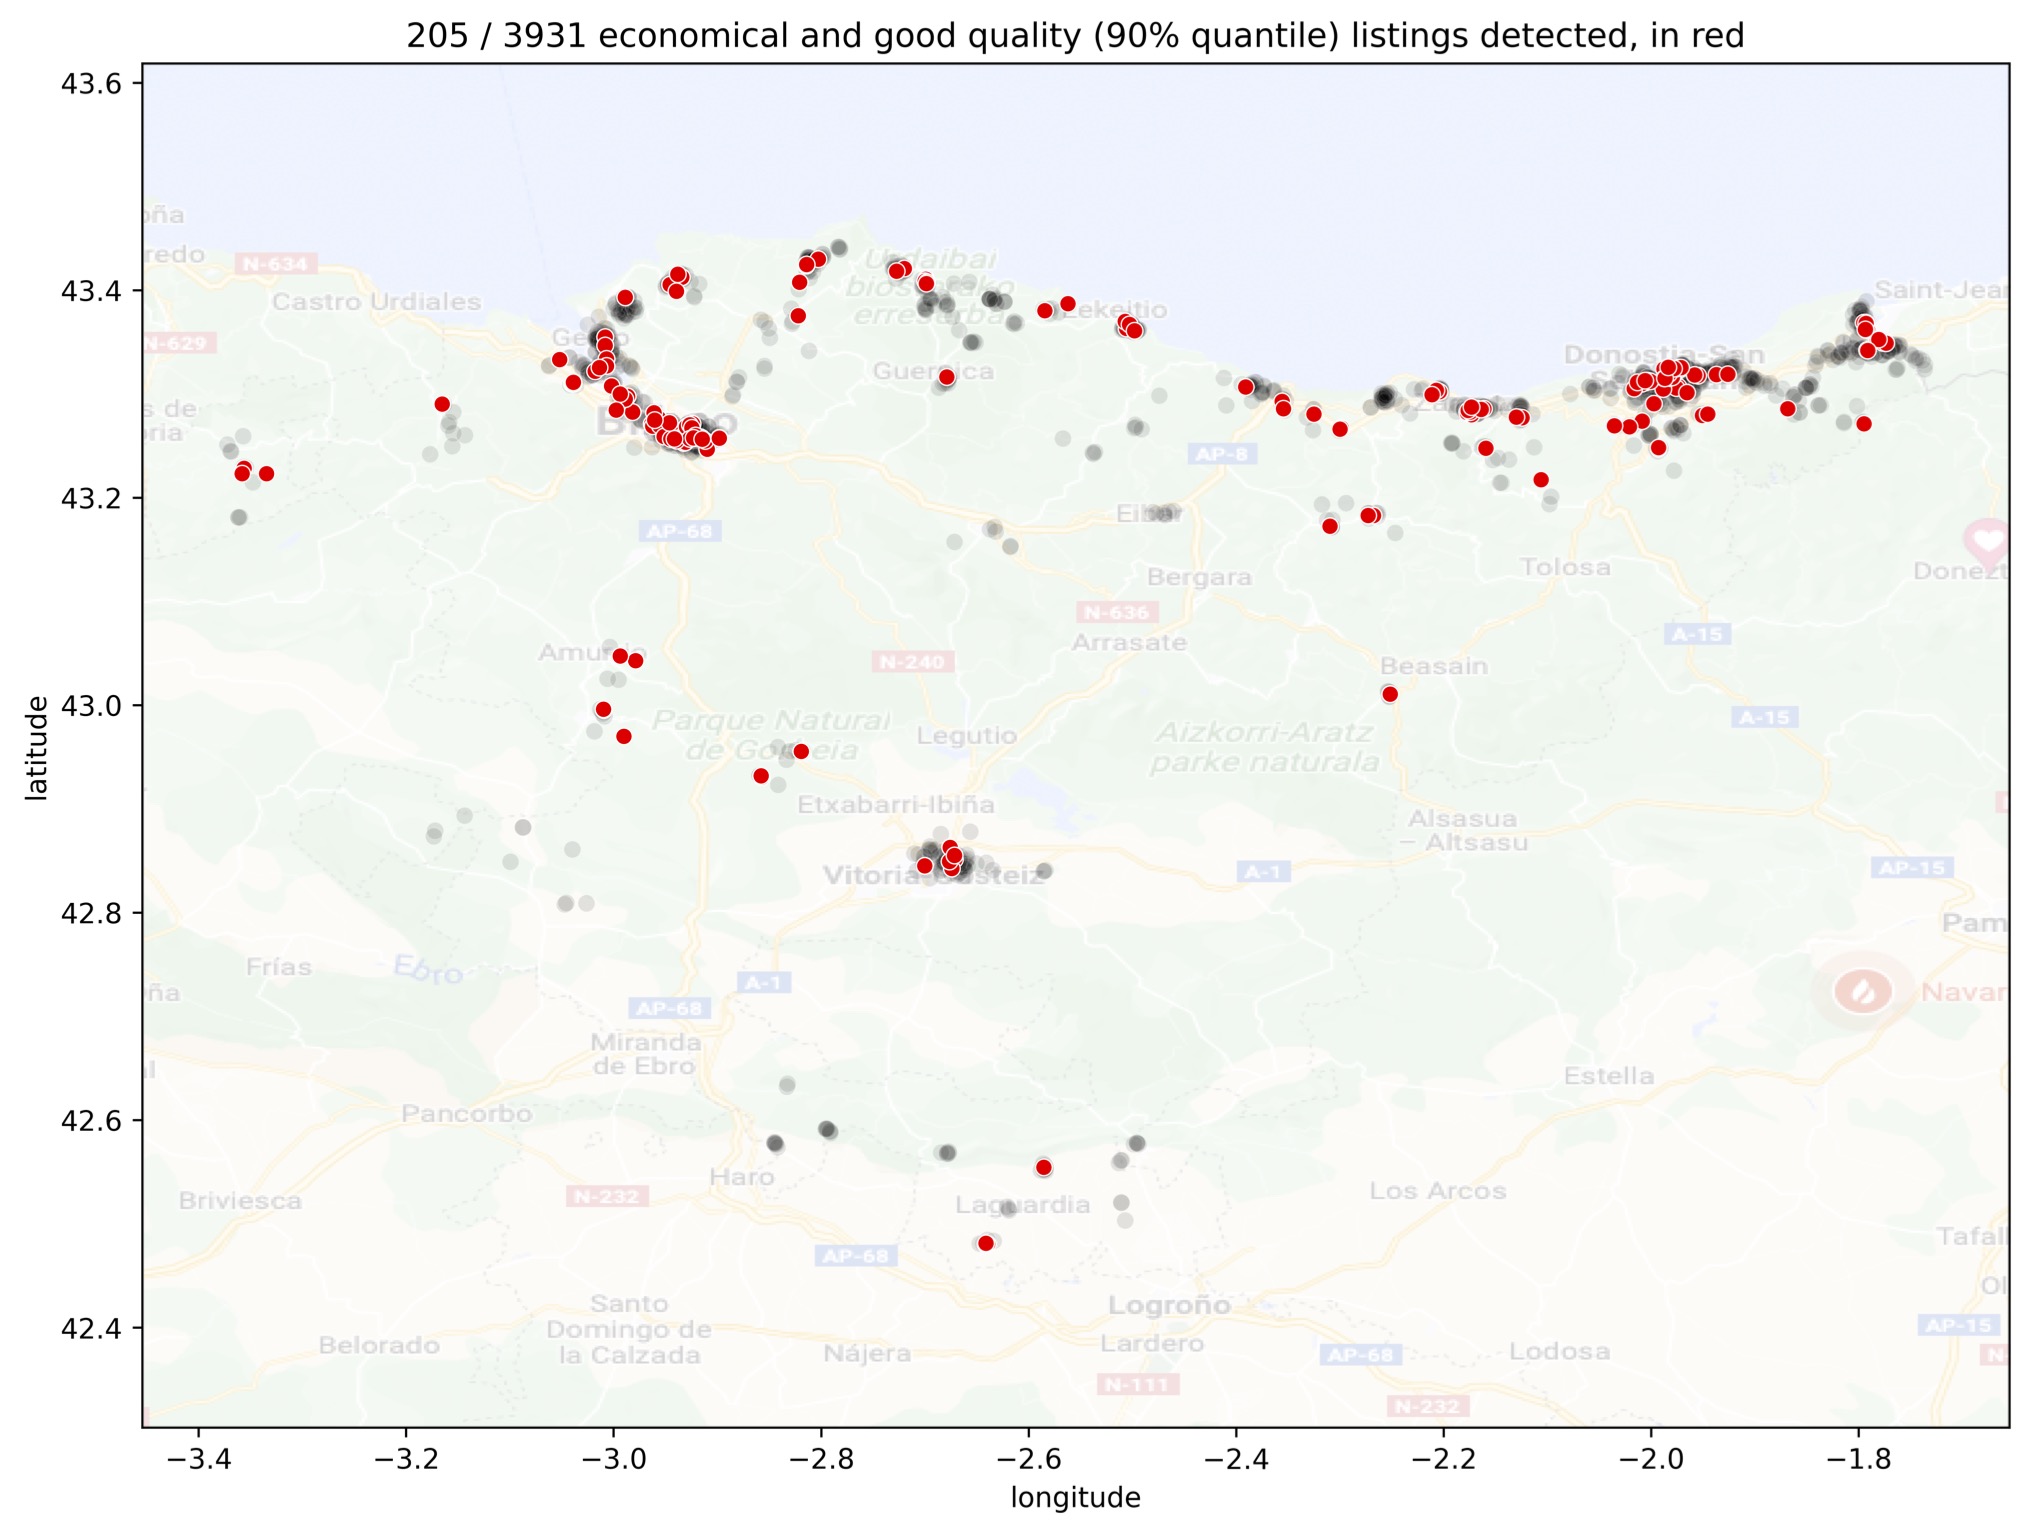
I prefer not post the URLs of the detected listings, but it is straightforward to obtain them using the notebooks of the linked repository ![]() .
.
Question 2: To Beach or not to Beach
Of course, you can always go to the beach to catch some waves in the Basque Country, but going on foot and in less than 15 minutes has an additional cost, on average. That is one of the insights distilled from the next diagram.
This difference or significance plot shows the T and Z statistics computed for each feature considering two independent groups: accommodations with and without beach access. These statistics are related to the difference of means (T statistic, for continuous variables) or proportions (Z statistic, for discrete variables or proportions). If we take the usual significance level of 5%, the critical Z or T value is roughly 2. That means that if the values in the diagram are greater than 2, the averages or proportions of each group in each feature are significantly different. The probability of being otherwise but incorrectly stating that they are different is 5%.
The sign of the statistic is color-coded: blue bars denote positive statistics, which are associated with larger values for accommodations that have beach access.
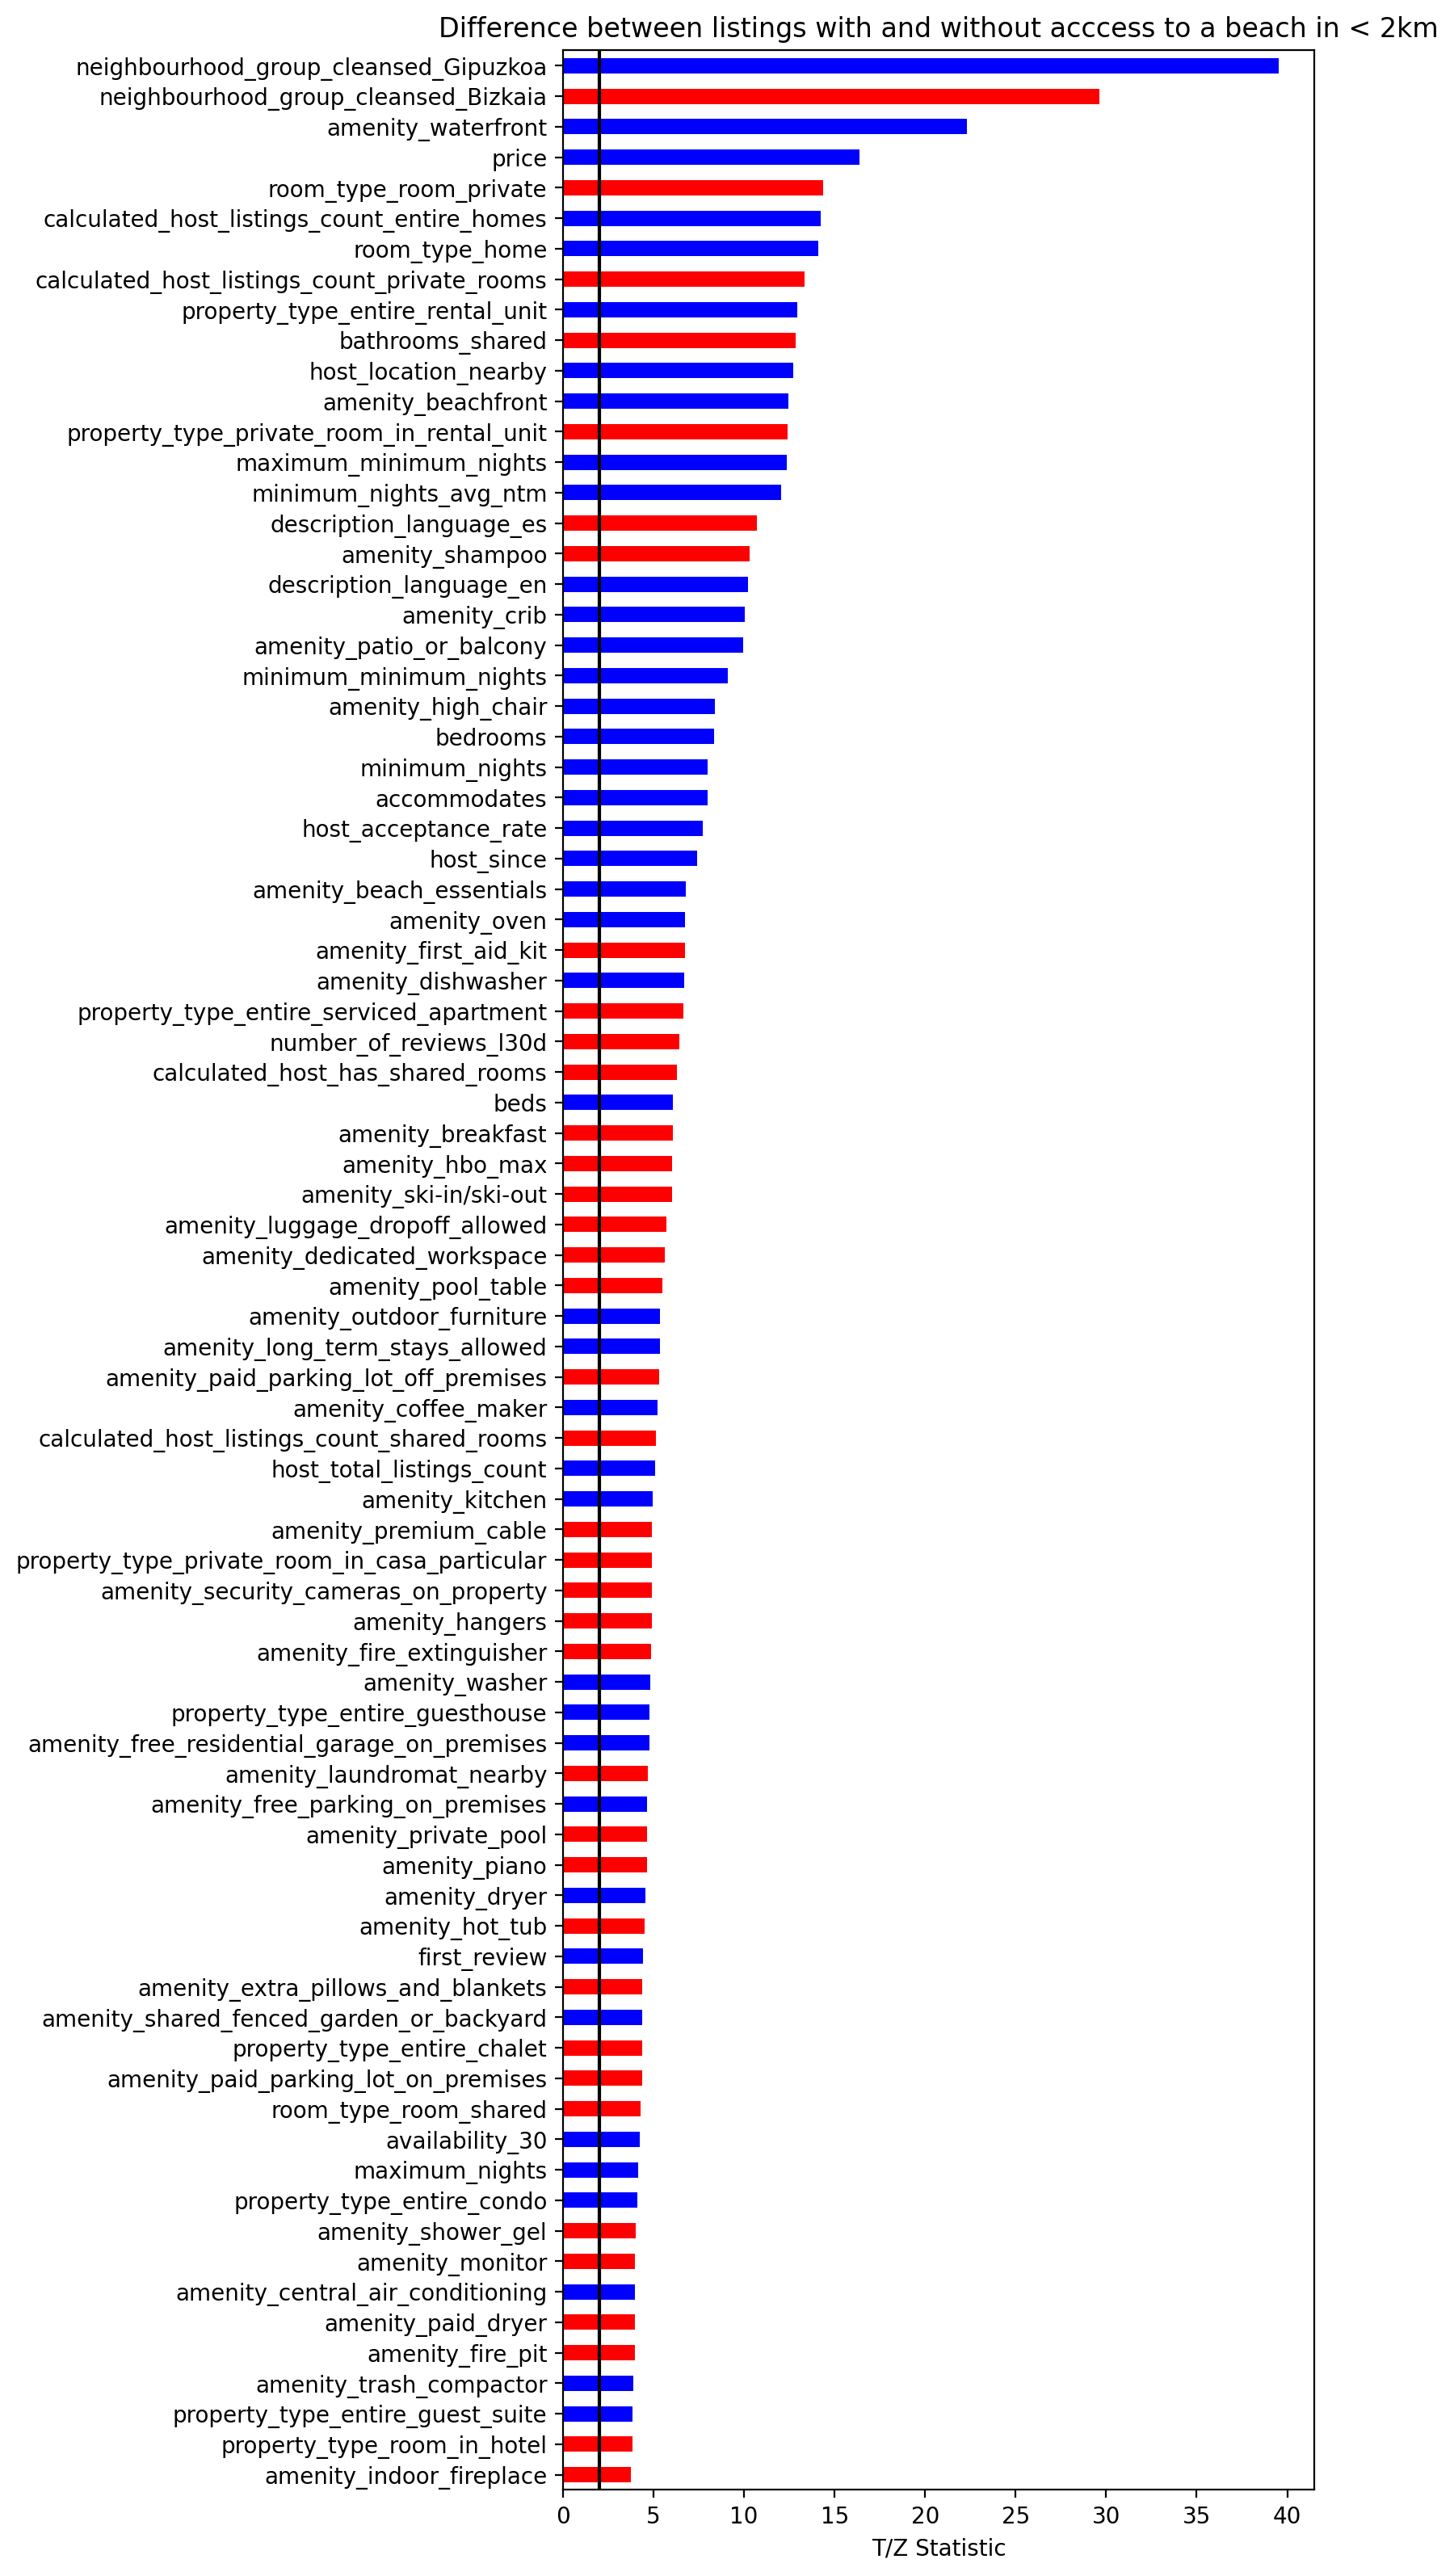
Long story short, here’s the interpretation: the group of accommodations that have a beach within 2 km have significantly larger
- proportions of accommodations located in the province of Gipuzkoa, compared to Bizkaia,
- proportions of accommodations with a waterfront,
- and prices.
Note that larger statistics don’t necessarily mean larger differences; instead, they mean that the probability of wrongly stating a difference between groups is lower.
Instead of reading the ranking top-down, it is more interesting to compose a profile of listings with beach access and without by selecting features manually; for instance, the accommodations on the seaside:
- have larger prices,
- are more often entire homes or apartments,
- usually have less shared bathrooms,
- have more often a description in English instead of in Spanish (i.e., they target more foreign tourists),
- have more often a beachfront, patio or balcony,
- have more bedrooms,
- allow for more accommodates but for longer minimum periods,
- their host lives more often nearby,
- …
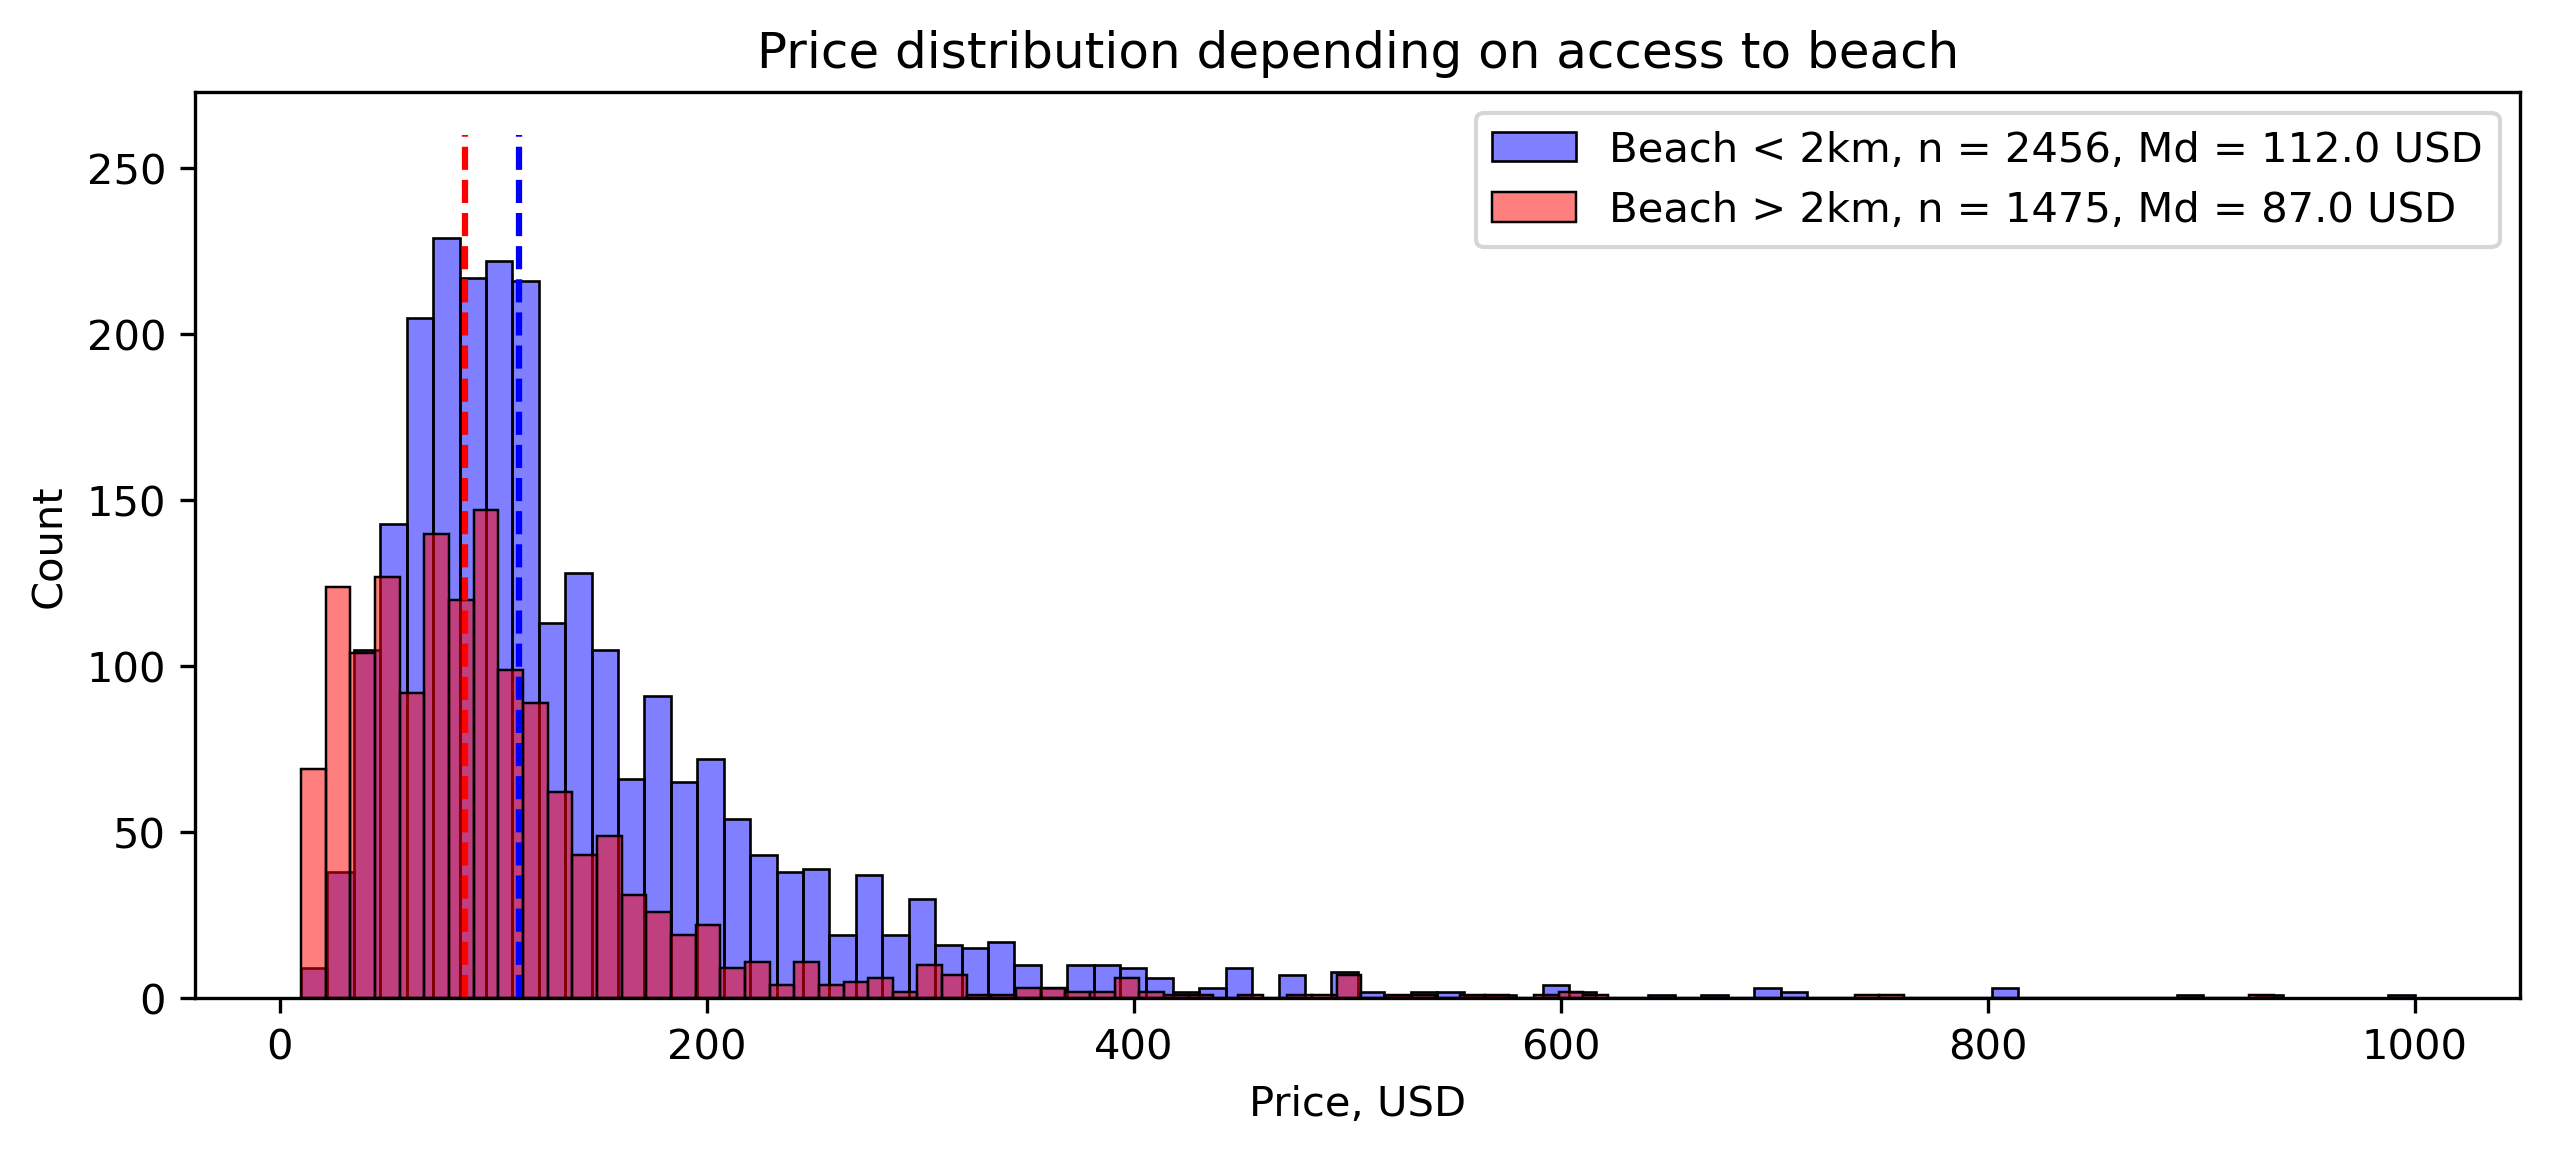
Going back to the price, the following figure shows the different price distributions for accommodations with a beach in less than 2 km and further. We need to consider that there is such a distribution or a contingency table behind each of the Z/T statistics in the previous diagram.
Question 3: Athletic de Bilbao vs. Real Sociedad
If you’re a soccer fan, maybe you’ve heard about the Basque derby: Athletic de Bilbao vs. Real Sociedad. Both football teams are originally from the two major cities in the Basque Country, Bilbao and Donostia-San Sebastian, and they represent the healthy rivalry between the two province capitals.
In order to determine the differences between the two cities in terms of listing features, I have computed the same difference or significance plot as before, shown below.
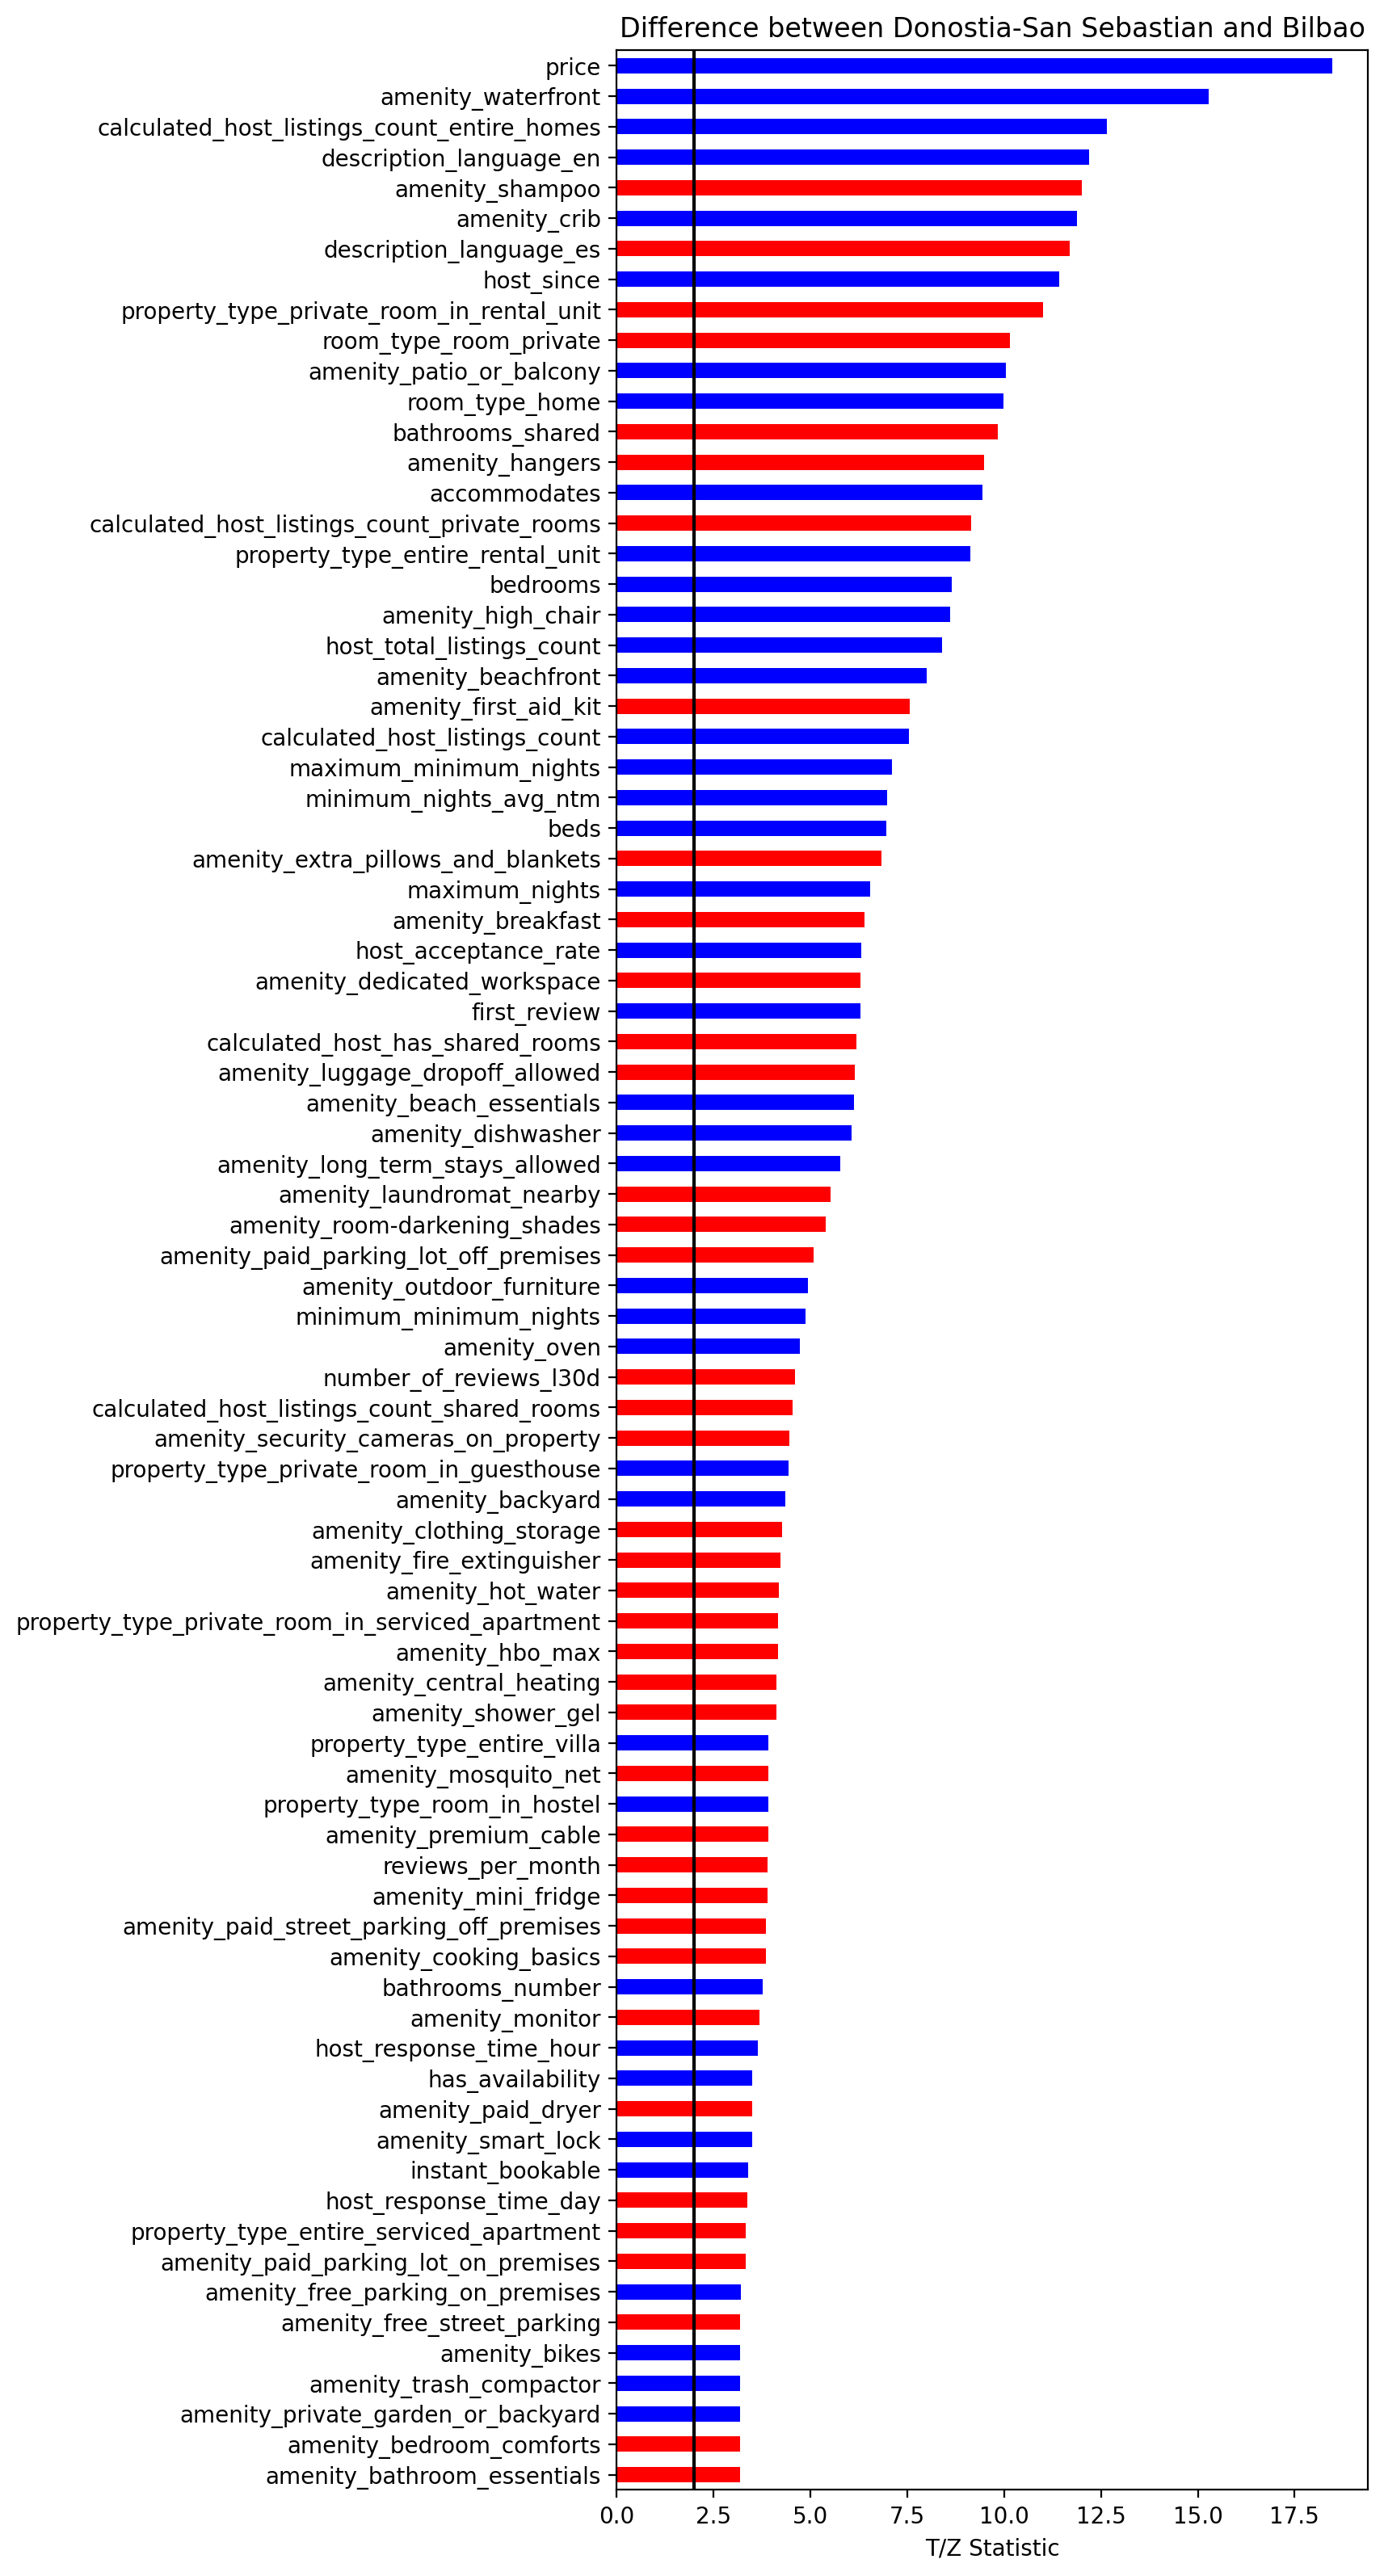
Donostia-San Sebastian seems to have
- larger prices,
- more accommodations with waterfronts,
- more descriptions in English,
- hosts that joined AirBnB longer ago and who have more accommodations,
- more often patios or balconies,
- more often entire homes or apartments,
- more space for accommodates,
- …
On the other hand, Bilbao has
- more accommodations that are a bedroom,
- more shared bathrooms,
- more amenities, such as shampoo, hangers, first aid kits, extra pillows, breakfast
- …
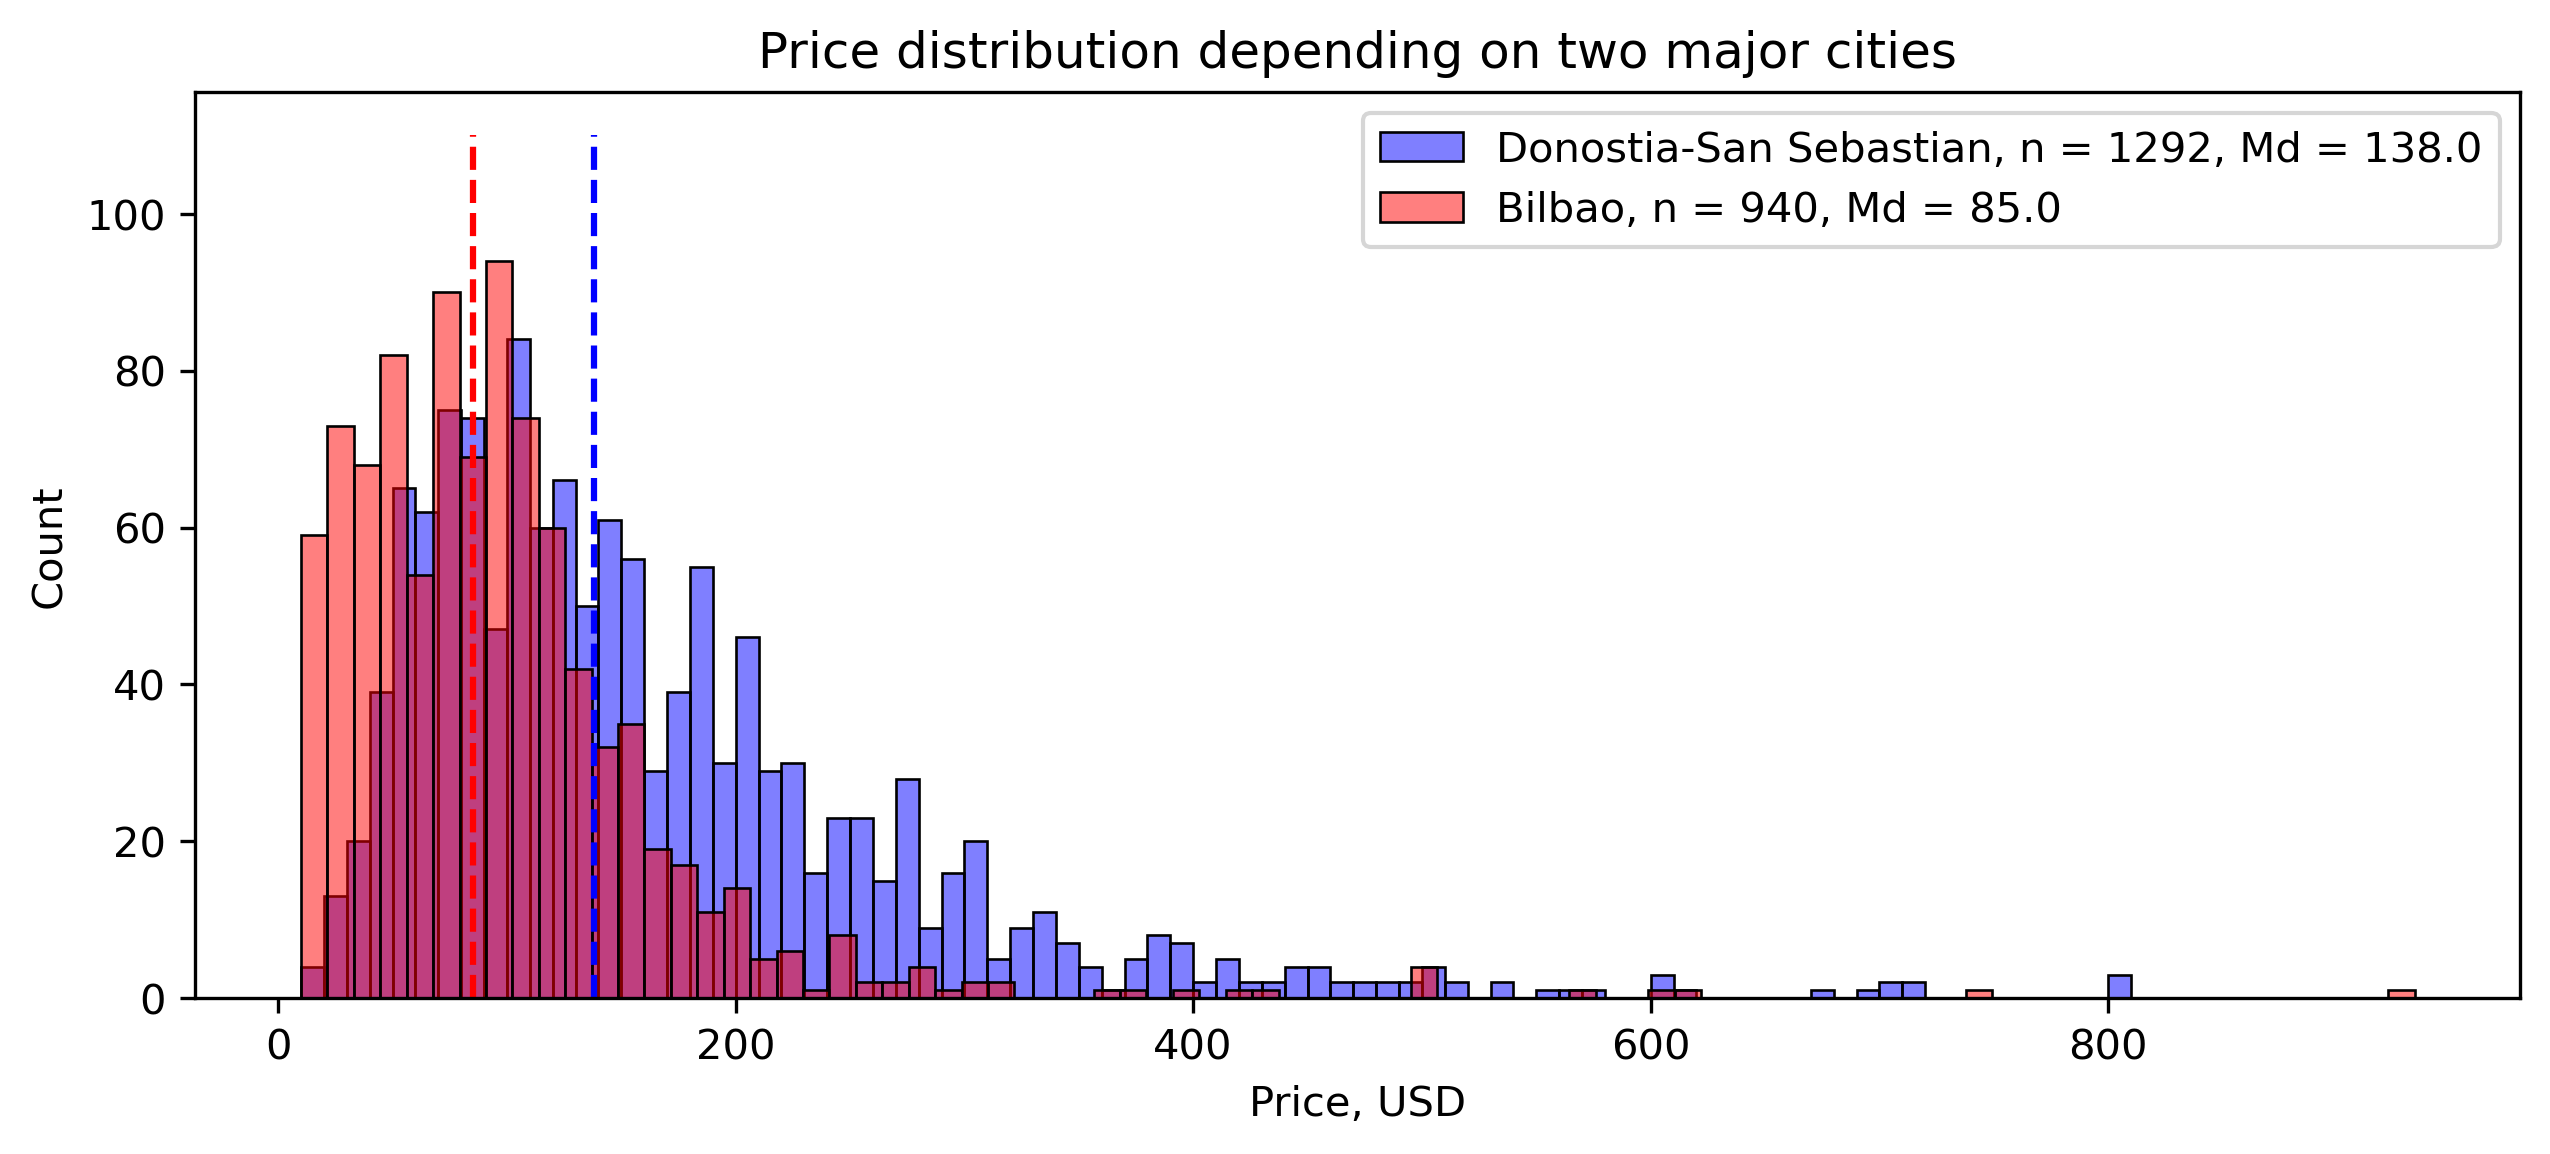
Finally, as before, I leave the price distribution for both cities, since it is the feature in which the difference is more significant. We can see that the distribution from Bilbao has more units in the lowest price region, whereas the red city lacks listings with prices above 150 USD, compared to Donostia-San Sebastian. That is in line with several already explained facts, such as that Bilbao has more shared rooms, whereas Donostia has more entire homes, while being the effect on the price of both characteristics the opposite.
Conclusions
In this blog post, we took a look at the AirBnB accommodation properties from the Basque Country, narrowing down to these insights:
- Even though the price regression models have a moderate R2, we have shown how to detect listings which are candidate to be a bargain: accommodations with high review scores and predicted price above the true one. Additionally, we have discovered the features with the largest impact on the price: type of accommodation, bathrooms, locations, etc.
- Listings with a beach in less than 2 km have significantly more entire homes, more balconies, waterfronts and space for more accommodates; this is in line with their larger prices.
- The two major cities Donostia-San Sebastian and Bilbao nicely align with the previous synthesis, being Donostia a beach city and Bilbao a city without. Additionally, Bilbao seems to favor other practical domestic amenities.
These conclusions are quite informal, but I hope they can guide my data-savvy friends; in any case, I’m sure you can have a great vacation anywhere you go in the Basque Country :)
Are you planning a trip to the Basque Country? Has this blog post helped you?
To learn more about this analysis, see the link to my Gihub repository. You can download the pre-processed dataset and ask the data your own specific questions!